
[Digital] Science
The Planet of the Nameless
May 21, 2026 Reading time: 5 minutes

Picture this, dear Earthling: a soggy little rock called Earth, crawling with squishy biological beings we politely call “humans”. These creatures lug around fancy central processing units (a.k.a. brains) that keep their carbon-made shells running by constantly stealing molecules from other shells. Usually the ones with dumber brains. They call this “food”.
But here’s the hilarious part: They insist on labels. They call it “individuality”. Without little name tags, how would they know who to fight, who to simp for, and which tribe gets to wear the matching silly hats this week? Their entire sense of self-worth depends on being uniquely part of a group.
Built on Mathematical Patterns: The Fibonacci Sequence and the Golden Ratio
April 28, 2026 Reading time: 7 minutes
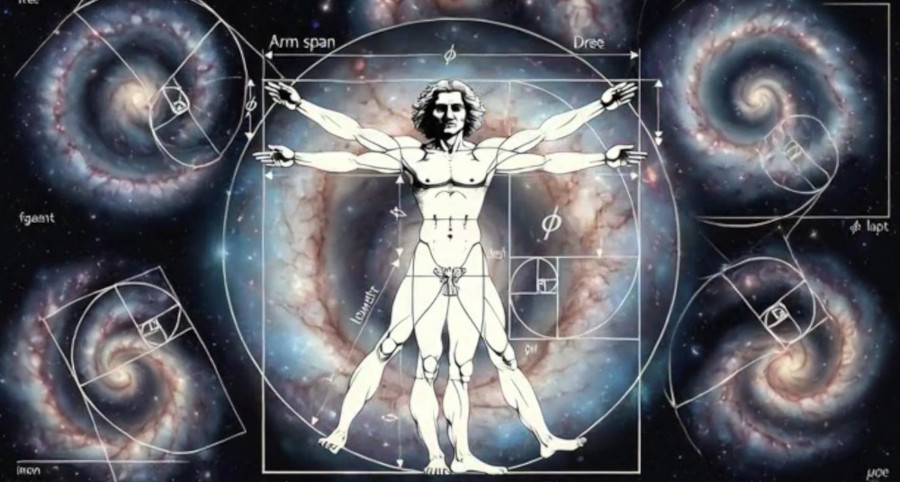
YouTube Video: You Are Built on Mathematical Patterns: The Fibonacci Numbers and the Golden Ratio
Whatever we study — from the smallest atoms to the largest galaxies — seems to follow underlying mathematical patterns. Among the most famous of these are the Fibonacci sequence and the Golden Ratio, both of which appear with surprising frequency throughout nature. They are everywhere!
The Fibonacci sequence is a series of numbers in which each term is the sum of the two preceding ones. It unfolds, starting from 1, as follows: 1, 2, 3, 5, 8, 13, 21, 34, and so on, continuing infinitely. As the sequence progresses, an interesting relationship emerges: when you divide one number by the one before it, the result approaches a constant value — approximately 1.62.
Stop Trading Time for a Future
February 14, 2026 Reading time: 5 minutes

One morning, you find yourself realizing that your retirement party is over. It was yesterday, now it is today. You are in a home office. You feel absolutely hollow. Several decades of work behind, a pension ahead, and all there was to do was stare at the wall wondering what the hell had been happening all those years.
When you were young, you were told to build a career, climb the ladder. And save for retirement. Make progress, go for promotion, and go for promotion again. Get a higher salary, and save money again. The focus was always on moving up, never on asking whether the destination was even desirable. But where do you move, did you ask this yourself?
The Mathematical Universe
January 24, 2026 Reading time: 3 minutes

You find yourself in this universe. Beneath its surface, natural laws — forged with astonishing precision. They co-exist in a delicate balance, interlocking one another. They make your appearance possible.
We uncover these laws through abstract ideas of mathematics. They manifest to us as traces of a deeper blueprint, or a hidden order that binds reality together. Simple formulas describe the workings of the cosmos, and this simplicity itself is puzzling. Why are these laws so elegant, so compact, so easily grasped? Long before experimental confirmation, these formulas often exist as pure abstractions, waiting to be recognized.
Why MDPI Is Not a Predatory Publisher
January 14, 2026 Reading time: 8 minutes
From time to time, one hears the claim that MDPI (https://www.mdpi.com/) is a "predatory journal". I would like to state clearly at the outset that, according to any reasonable metric, MDPI does not meet the definition of a predatory publisher. The main reason it is often perceived as such is that it operates under a different funding and publishing model than traditional subscription-based journals, which makes it stand out from long-established publishers.
Below, I address the most common characteristics of predatory journals and explain why they do not apply to MDPI.
When Math is Matter: Average and Median American Net Worth
December 5, 2025 Reading time: 3 minutes
As of 2024, the average American's net worth stands at a striking $620,000, according to a recent UBS report on global wealth. At first glance, that number might seem unexpectedly high, even out of touch with your own financial reality. If that’s the case, you’re not alone. There’s an important reason for this disconnect.
The figure of $620,000 is an average, a statistic that can be misleading when it comes to understanding the financial reality of most people. In statistics, averages are calculated by adding up the total wealth of a group and then dividing that sum by the number of individuals in the group. However, this simple math can be easily skewed by a few individuals who possess extreme wealth, making the overall average look much higher than it actually represents for the majority.
HandWiki: An Open-Source Alternative Knowledge Platform
December 2, 2025 Reading time: 4 minutes

HandWiki is an online, open-source encyclopedia focusing on science, technology, mathematics, computing, and related scholarly fields. The platform hosts a large collection of articles derived from openly licensed sources and written by volunteers. HandWiki is operated by the ErmisLearn initiative, which supports open-knowledge and research-oriented educational projects.
Quantum Entangled Lives
October 31, 2025 Reading time: 9 minutes

YouTube video "Our Quantum Entangled Lives".
If you know a bit about science, you've probably heard of one of its most fascinating phenomena: quantum entanglement. It's the kind of thing that makes even scientists pause and ask, "How can this be possible?"
Let's break it down. Imagine two separate microscopic particles, each with its own measurable properties-like energy and charge. Now, suppose we bring them together and make them interact. In that moment, a new quantum system emerges-one that can no longer be described simply by the individual properties of each particle. Their states become linked in such a way that measuring one instantly influences the other, regardless of how distant they may become.
The Revelation of Walter Russell’s Coma
October 7, 2025 Reading time: 7 minutes

Introduction to the YouTube video Closer to the Truth: The Revelation of Walter Russell’s Coma.
In 1921, American polymath Walter Russell entered a 39-day coma-like state during which he claimed to have accessed “the source of all knowledge.” Upon awakening, he transcribed the visions he had received—pages brimming with philosophical, scientific, and spiritual insights. Russell claimed that during his 39-day experience, he was taken into what he called the "Light of Knowing." He believed he was given a divine mission to bring a new understanding of the nature of the universe and humanity's place within it. These writings would later become the foundation of his manuscript, “The Universal One” published in 1926.
Reinforcement Learning for Retail Price Optimisation: State, Action, Reward Design
September 10, 2025 Reading time: 5 minutes
UK retailers are exploring reinforcement learning to move past static rules and blunt markdown schedules. The aim is smarter price moves that respond to demand in near real time while protecting long-term margin and customer trust. In this article, we'll explore what to do, how to frame state, action, and reward, set sensible guardrails, and wire the outputs into day-to-day trading.
For a clear UK overview of what reinforcement learning involves, see The Alan Turing Institute's reinforcement learning research area, which explains how agents learn through interaction rather than from fixed datasets.
About chances for monetization of a YouTube channel
September 5, 2025 Reading time: 5 minutes

According to YouTube Stats, there are 114 million active YouTube channels in 2025. About 321,000 channels have surpassed the 100,000 subscribers, according to statistical data. Only 10% of those can be monetized with more than 100$ per day (ask ChatGPT for this number - it will pull a few reliable sources). The chances of success for channels with fewer than 100,000 subscribers and earning more than $100 per day are quite small and can be ignored. So, the probability of a newly created YouTube channel earning more than $100 per day is just 0.00028 (or 0.028%) [1]. This figure is significantly lower than the probability of being killed in a U.S. city [2].
Scientists and Belief
September 2, 2025 Reading time: 4 minutes

Introduction to the video "Science and Belief".
Maybe you've encountered a question like this: How can scientists believe in God, spirituality, or anything that doesn't seem scientific?
The answer is simple: we all believe in something. Scientists are no exception. While they trust scientific results, they also recognize that truth is not revealed by science alone. Many aspects of human experience lie outside the scope of science, yet they may still be real and shown to be true.
Unknowable Universes
August 14, 2025 Reading time: 6 minutes

YouTube Video Unknowable Universes
The laws of nature reveal astonishing beauty. Everyone knows the famous equation that links energy to mass-energy equals mass times the speed of light squared. Who doesn't? Scientists have measured this relation with extraordinary precision - within about 0.00004%, or roughly one part in 2.5 million.
The deeper question, however, is this: why does this formula look so simple? It's no more complicated than calculating the area of a circle, which equals π times a radius squared, where the constant π is known with extraordinary accuracy. This equation is exact; the only limitation lies in our ability to measure the radius. Why is it that the most fundamental equations governing our universe-the ones shaping reality itself-are often the simplest? In fact, the key laws that define our world, like those of gravity and electromagnetism, are remarkably straightforward. While some laws appear more complex, their role in shaping the universe is comparatively less significant.
When the Mirror Looks Back
July 15, 2025 Reading time: 8 minutes

Introduction to the video story When the Mirror Looks Back.
Of course, you know you're self-aware. Who doesn't? You approach a mirror and find yourself staring back, grasping the profound strangeness of existence - A biological being reflects photons - light bounces off the glass, enters the eyes, and floods the brain with information, triggering an infinitely complex process that becomes the realization of this miracle. You can recognize the one standing before the mirror. It is you. And, even more - there are rare moments in life when you pause and ask: Who am I? What does all of this mean?
Justapedia: Exploring endless horizons of infinite knowledge
July 3, 2025 Reading time: 3 minutes

Open‑source knowledge platforms are constantly evolving, and Justapedia™ offers a distinct model alongside well‑known encyclopedias such as Wikipedia. Both projects embrace open licensing and collaborative editing, yet Justapedia prioritizes editorial independence, flexible content policies, and full preservation of its revision history.
